Your Story Belongs on Our Stage
Every year at Helm Conference, something happens that you can’t replicate in a product demo or a webinar. The people actually doing the work — the fleet managers, the dispatchers, the safety officers, the operations leads — get in a room together and start talking. And what comes out of those conversations is genuinely useful in a way that’s hard to manufacture.
Through the Spyglass: Improving Accessibility and Consistency in Helm CONNECT
Welcome to Through the Spyglass! In this series, we preview some of the cutting-edge features coming to Helm CONNECT and invite you to share your thoughts with us. In this edition, we’ll examine some visual changes and UI improvements that we’re working on for later this year.
Butts on Boats: Why You’ll Be Seeing Us Soon
At Helm Operations, a lot of our work happens behind screens. We build software, write documentation, answer support tickets, and make decisions based on workflows and data. But the reality of our customers’ work—the vessels, the crews, the dispatch rooms, the day-to-day operational pressure—often lives somewhere else entirely. It’s not something we can get from an email or a meeting, so this year, we’re going to close that gap.
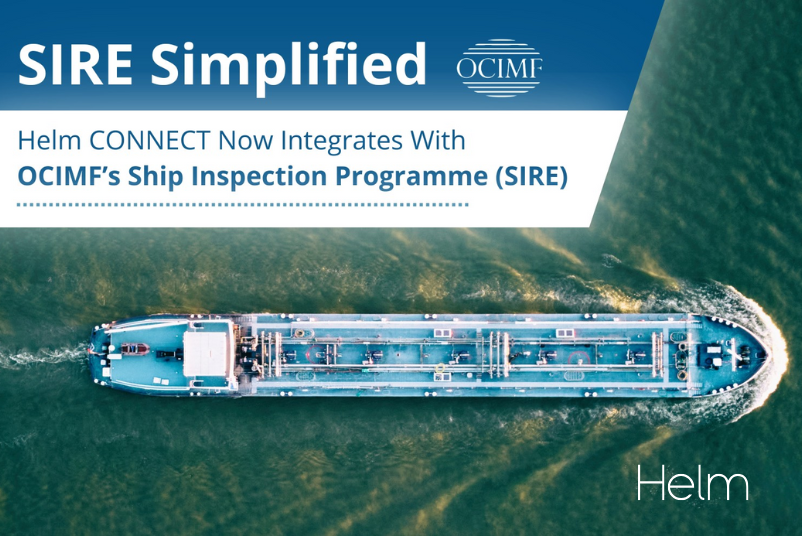
SIRE Simplified: Helm CONNECT Now Integrates With OCIMF’s Ship Inspection Programme
Staying on top of your operations while ensuring compliance can be a burden when things are busy. When the time comes for your SIRE inspections, the task of tracking, monitoring, and coordinating your inspection’s findings can quickly become a drag on the productivity of key resources. While a necessity for the industry, it begs the question: is there a more efficient way to deal with recurring SIRE inspections?

Helm Reaches 400 Customers for Helm CONNECT, Strengthening Its Position as the Operational Backbone of Modern Fleets
VICTORIA, BC – [December 11, 2025] : Helm Operations announced today that it has reached 400 customers and more than 10,000 vessels and assets running on Helm CONNECT worldwide, marking a major milestone for one of the maritime industry’s most widely adopted maintenance and operations platforms.

Helm is Hitting the Main Aisle at WorkBoat 2025 — Come See What’s New
The Helm crew is heading to New Orleans next week for the International WorkBoat Show, and this year is a little different. For the first time ever, we’re stepping out of the shadows of the side aisles and planting our flag right on the main aisle at Booth 3529. That’s right—big stage, bright lights, and no one can accidentally miss us on their way to a crawfish po’boy.

What's new in Helm CONNECT 1.34?
Welcome to Helm CONNECT 1.34. This release delivers improvements across Logistics, Personnel, and Maintenance, including the rebranding of Helm CONNECT Jobs to Logistics, ongoing enhancements to the new Crew Certifications module, and new workflows for managing low-stock parts.

Automate Your Fluid Analysis with Helm CONNECT
Every day, vessels around the world rely on fluid analysis to keep their engines and equipment running at peak performance. But the process can be slow and fragmented: samples are drawn, shipped to labs, and results trickle back by email — buried in inboxes, misread, or lost in the shuffle.

Charting New Waters: Lloyd’s Register and Marshall Islands Certify Our Electronic Record Books
For operators looking to move away from paper logbooks without compromising compliance, there’s now a class-certified digital alternative.

Helm CONNECT x Moxie Media LMS is Now Live!
We’re excited to announce that Moxie Media’s Learning Management System (LMS) is now seamlessly integrated into Helm CONNECT at no extra cost for users. If you already use Moxie Media’s LMS and want to activate it on Helm CONNECT, simply contact your Account Manager, and they will enable it for you immediately.

Big Changes on the Horizon: Helm CONNECT Jobs Will Soon Become Logistics
At Helm Conference 2025, Rachel Aylard, Product Manager for Helm CONNECT Jobs, shared some exciting news about the future of the product line. For those who weren’t able to join us at the conference, here’s a recap of what we announced, and what it means for you.

Helm Operations Announces Leadership Transition: James Wadsworth Appointed CEO, Nolan Barclay Named Chairman
Helm Operations, the leading provider of maritime operations and crew management software, today announced a key leadership transition as James Wadsworth assumes the role of Chief Executive Officer (CEO). Nolan Barclay, Helm’s first employee and most recent CEO, will continue to support the company as Chairman.

The Helm CONNECT Integration Portugs Used to Maximize Billing Revenue
In July 2020, Portugs, a Portuguese harbor services company owned by Grupo Sousa, made an innovative change to their operations in order to streamline a tedious manual process and improve communication with their agents. Using an integration between Helm CONNECT and their existing email client, Mailgun, Portugs now sends order confirmation emails automatically once jobs are scheduled.

A New Way to Track Your Crew Certifications
Tracking certifications for your crew is essential for compliance and safe operations. Our original Crew Certifications module has helped operators manage crew compliance for years, but we knew our customers needed even more flexibility, clearer requirements, and stronger integration with scheduling.

Helm Operations Announces Record-Breaking Helm Conference 2025
Largest gathering yet with 200+ attendees, 12 sponsors, and 20+ external speakers set to converge in New Orleans.
Notes from the Event Director: The BIGGEST
It’s official: this is going to be the biggest Helm Conference ever!

What's new in Helm CONNECT 1.33?
Helm CONNECT 1.33 is here, and it brings smarter tools for payroll, scheduling, and file management.

Notes from the Event Director: The Agenda is Live
The Helm Conference 2025 Agenda is Live, and it’s practically bursting with real-world takeaways from industry leaders like Crowley, Ingram, Curtin Maritime, and more. Check out what’s on deck here!

Notes from the Event Director: Let’s Talk Tickets
Your Helm Conference Event Director is here to make it easier for you to get tickets, and to justify why you and your team should come to the event, now more than ever.
Guest Post: Andrew Berthelson, Part 2 - The Invite
Part 2 of our special guest post from Andrew Berthelson, Director of Technology at Curtin Maritime. In this part, learn about what he created in order to bring the Helm CONNECT user community together!