Helm CONNECT Analytics 1.35 - See Everything, Fix Anything
This release is our biggest analytics update yet. We've shipped three completely new dashboards that tackle your most expensive operational challenges — slow billing cycles, fleet overcapacity, and reactive safety management. These aren't minor additions. Each one is designed to surface the insights that directly impact your bottom line, from cash flow optimization to asset utilization to incident prevention.
But that's not all. We've also made dozens of improvements across the entire analytics suite — faster load times, smarter filtering, cleaner visualizations, and more intuitive navigation. The dashboards you already use are now even better at helping you spot trends, benchmark performance, and make data-driven decisions.
Here's what makes this release different: No configuration required. No custom builds. No waiting six months for your BI team to deliver something half-baked. These dashboards work with the data you're already entering in Helm CONNECT. You log in, they're there, and they're already showing you where to focus. Instant insights that help you work smarter, bill faster, and prove ROI — starting today.
Maintenance
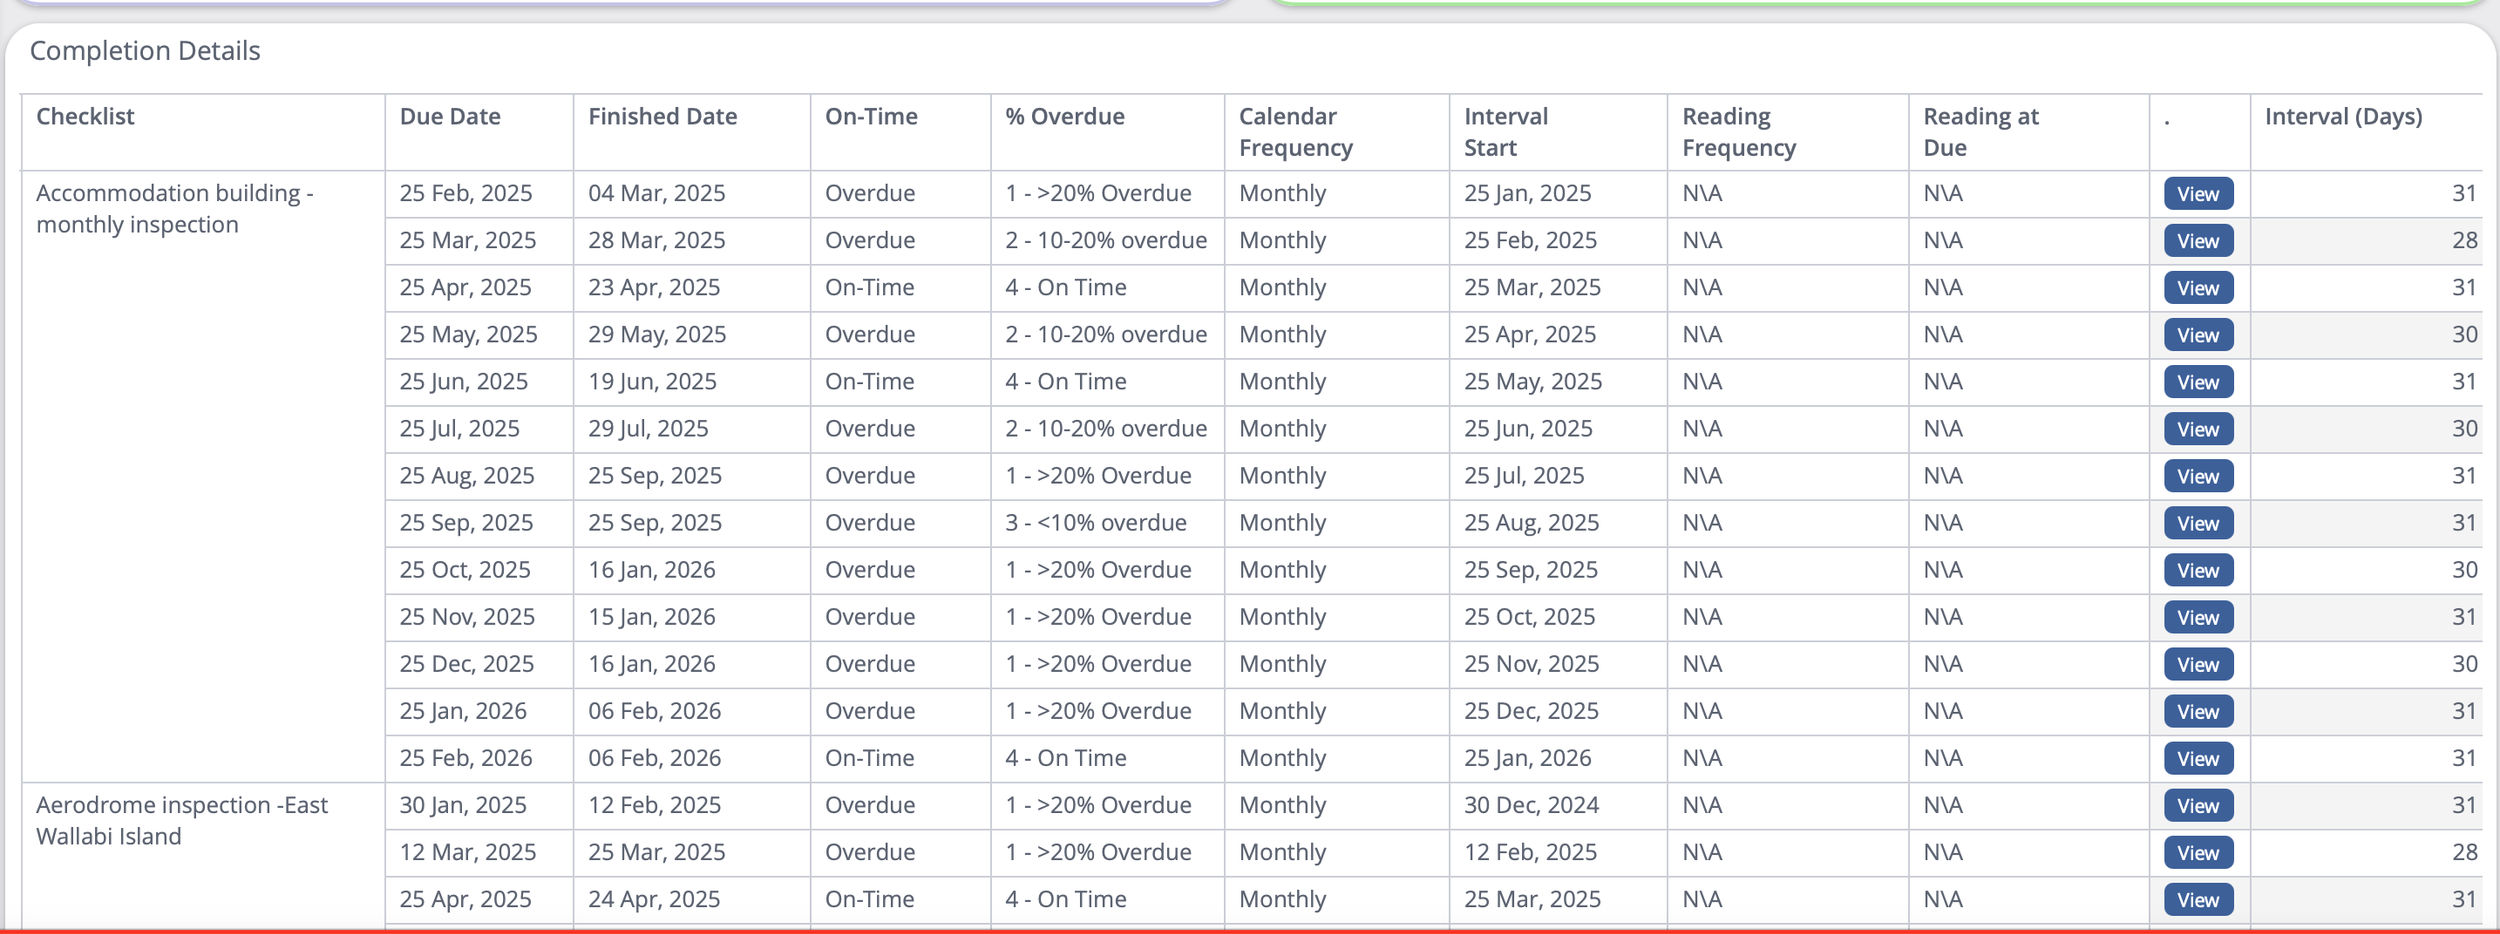
We’ve added the ability to open historical items in Maintenance Pro from within the dashboard. Plus, there are now Make/Model categorizations for common machinery added to Maintenance Pro/Tasks Pro.
Compliance
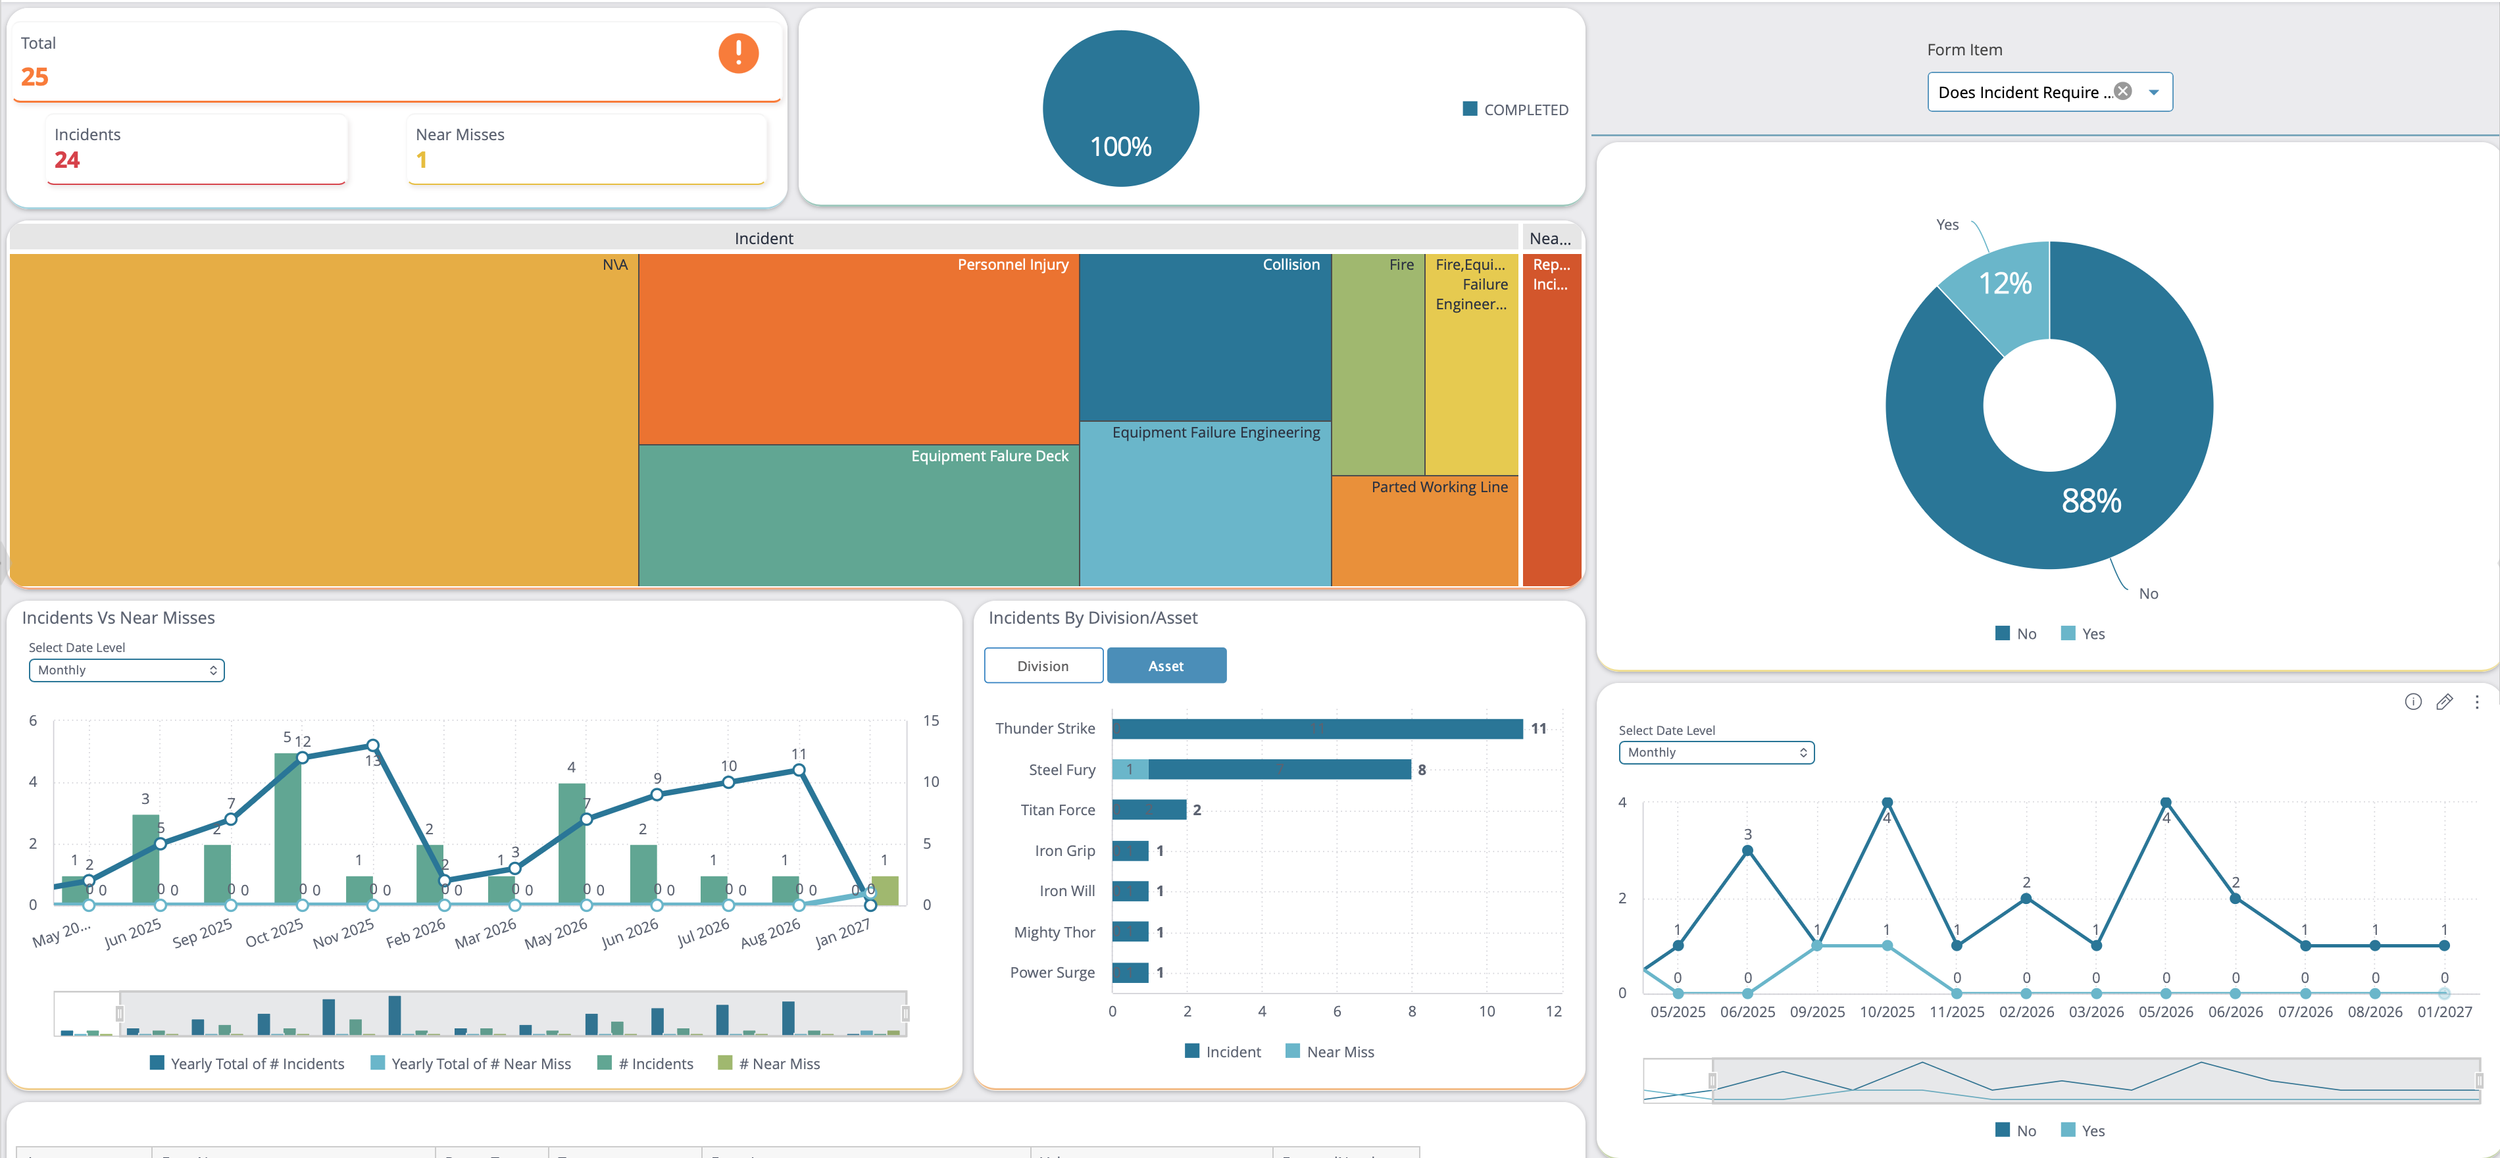
Incident Reporting Dashboard
Turn safety data into preventable trends, not just paperwork
You're logging incidents in Helm CONNECT, but are you actually learning from them? This dashboard aggregates incident data across your fleet so you can spot patterns, track trends, and prevent the next accident before it happens.
Why this matters:
See incident trends over time — Are things getting better or worse?
Break down by division, vessel, or incident type — Where are your highest-risk areas?
Track severity and outcomes — Which incidents result in lost time, damage, or near-misses?
Measure response effectiveness — How long does it take to close incidents and implement corrective actions?
Real impact: Proactive incident analysis reduces repeat incidents by 20-30% and helps you stay ahead of regulatory compliance requirements.
Perfect for: HSE Managers, Operations Directors, Compliance Officers, Risk Managers
Logistics
Logistics - Billing Dashboard
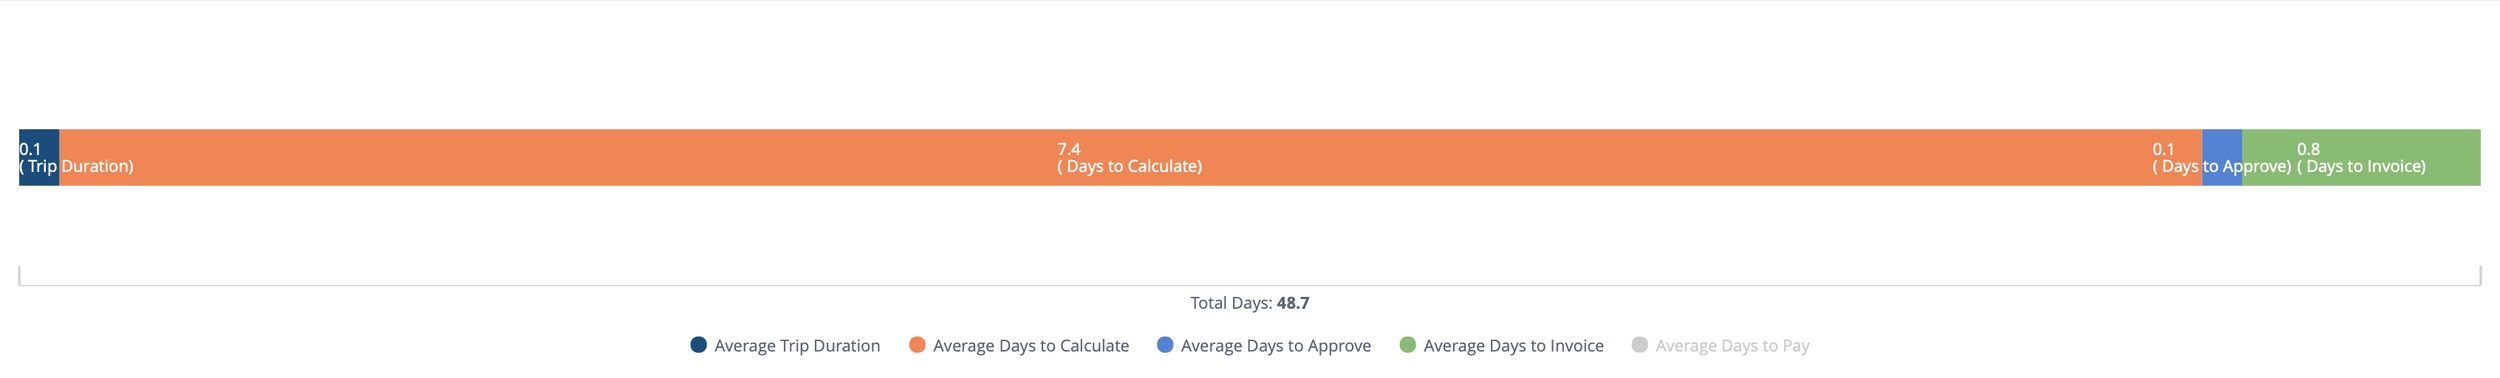
Finally answer the question: "Where is our cash stuck?"
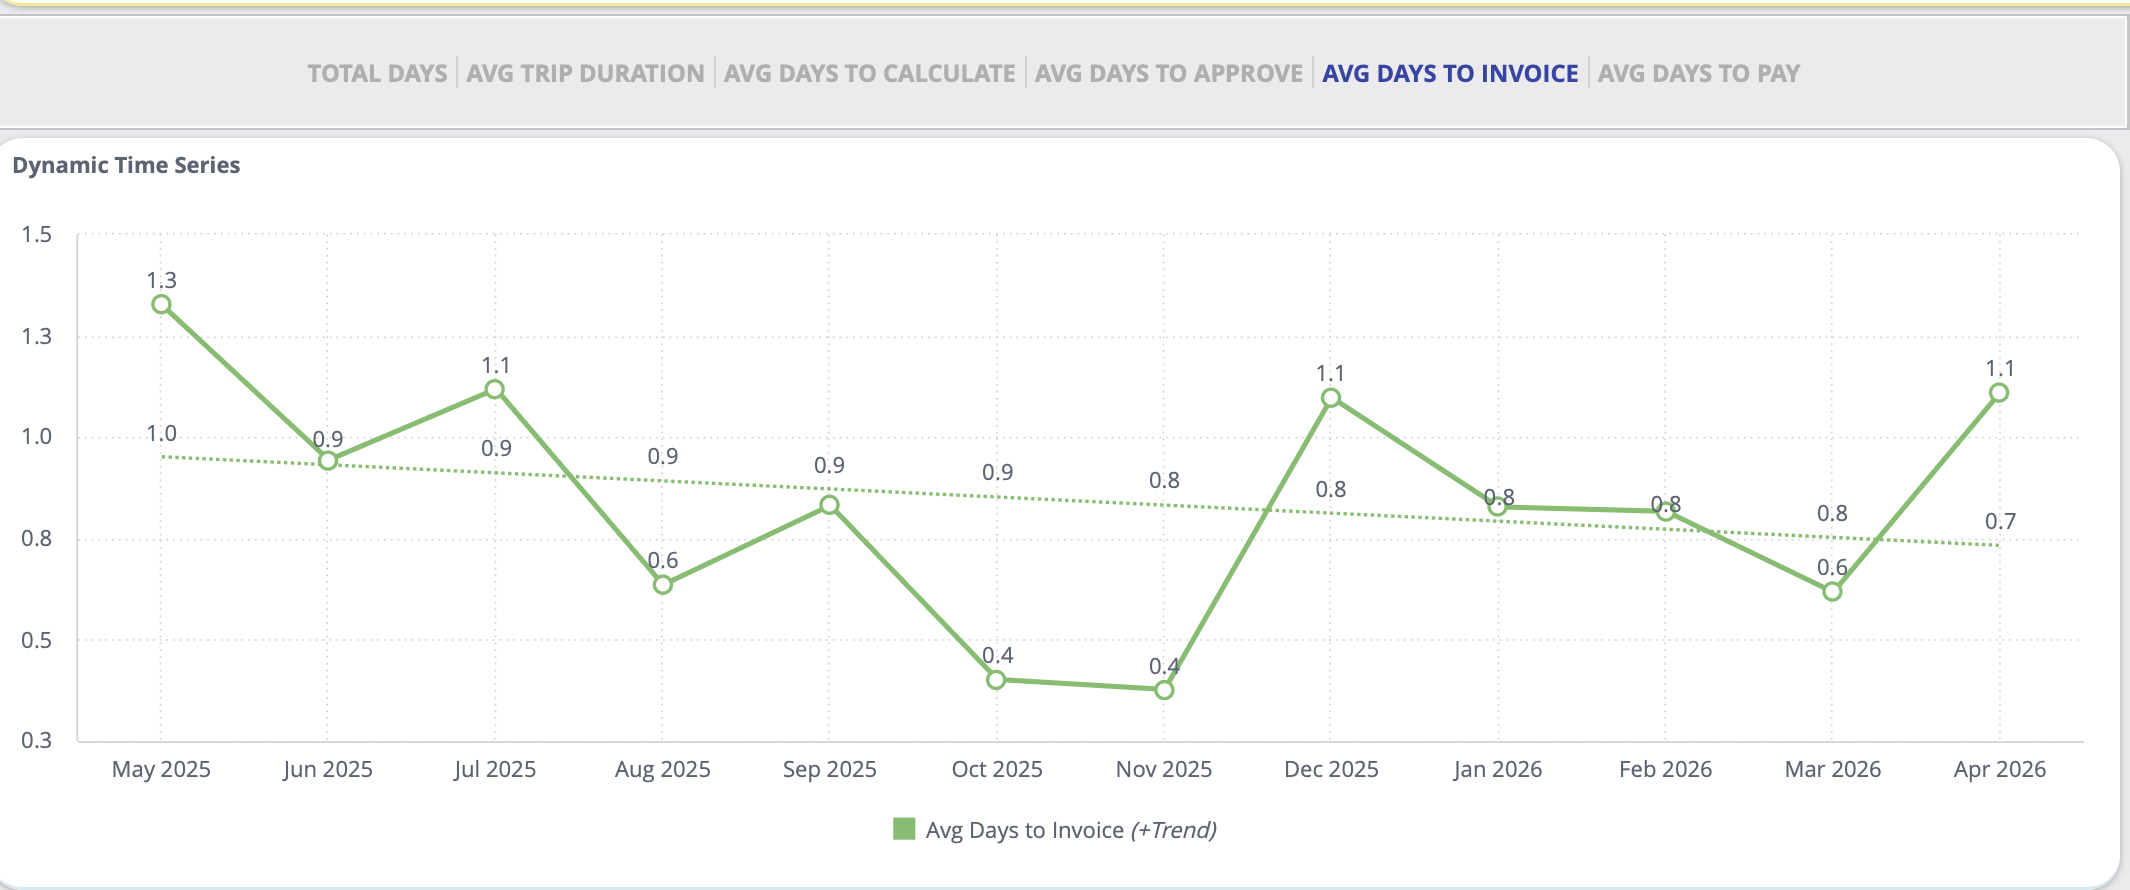
Your billing process has always been a black box. Not anymore. This dashboard shows you exactly where invoices are getting delayed — from draft creation to payment collection — so you can fix bottlenecks and get paid faster.
Why this matters:
See your entire invoice cycle broken down by stage: calculation → approval → invoicing → payment
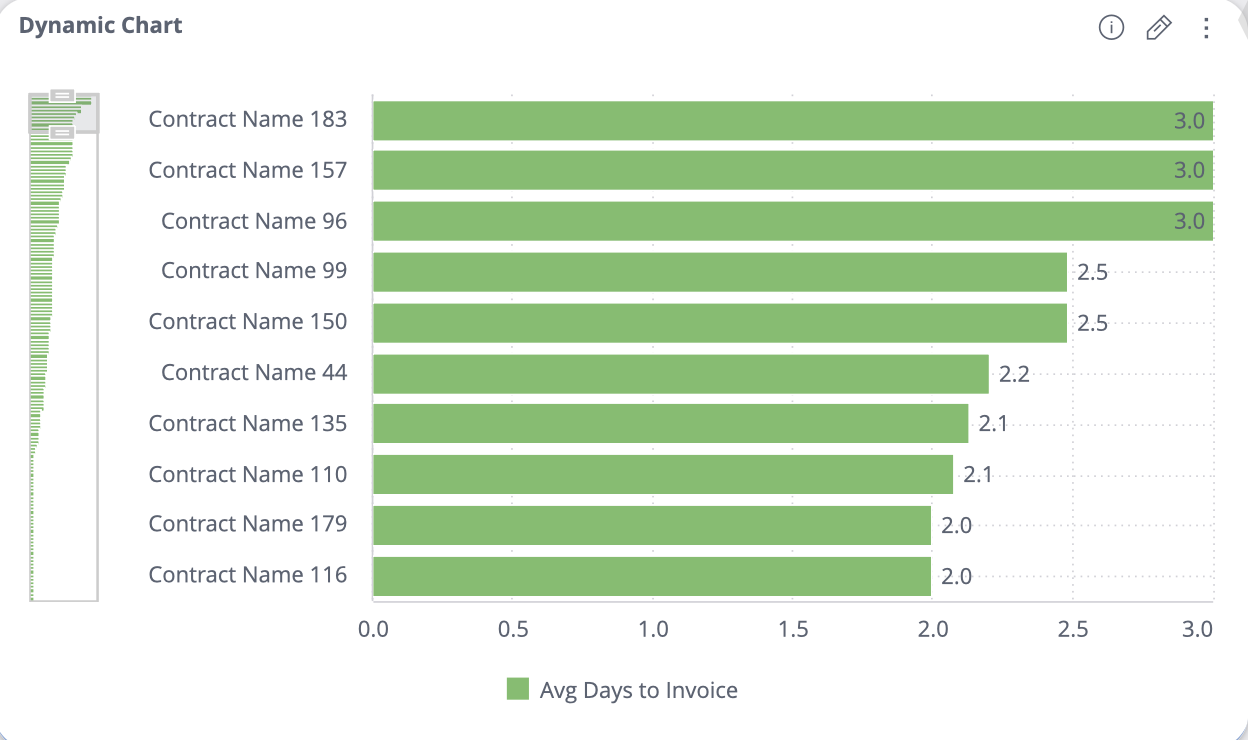
Compare divisions and customers to identify who's fast, who's slow, and why
Catch contract gaps automatically by tracking manual line items (if you're always manually adding charges to the same contract, it's misconfigured)
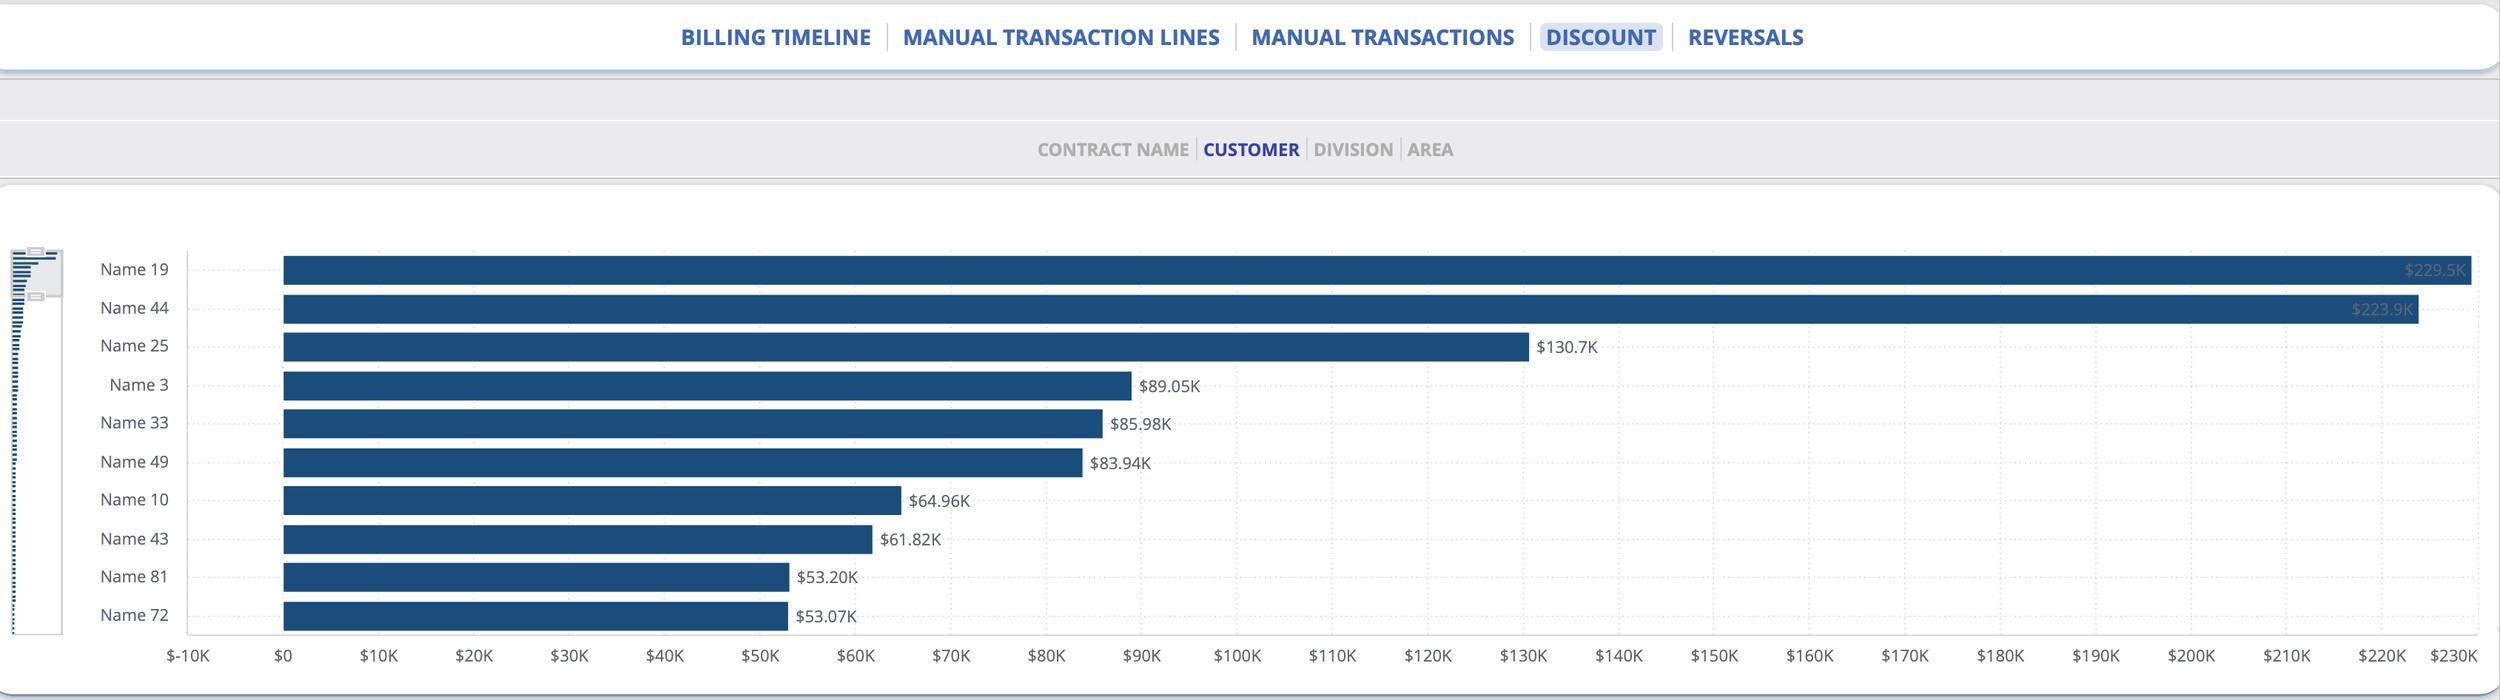
Track discount discipline across divisions to stop margin leakage
Real impact: Most customers using this dashboard reduce their invoice cycle by 5-7 days. On $50M annual revenue, that's ~$700K in freed-up working capital.
Perfect for: CFOs, Controllers, Billing Managers, Commercial Directors
Logistics - Terminal Utilization Dashboard
Answer the $2M question: "Do we have too many tugs in this port?"
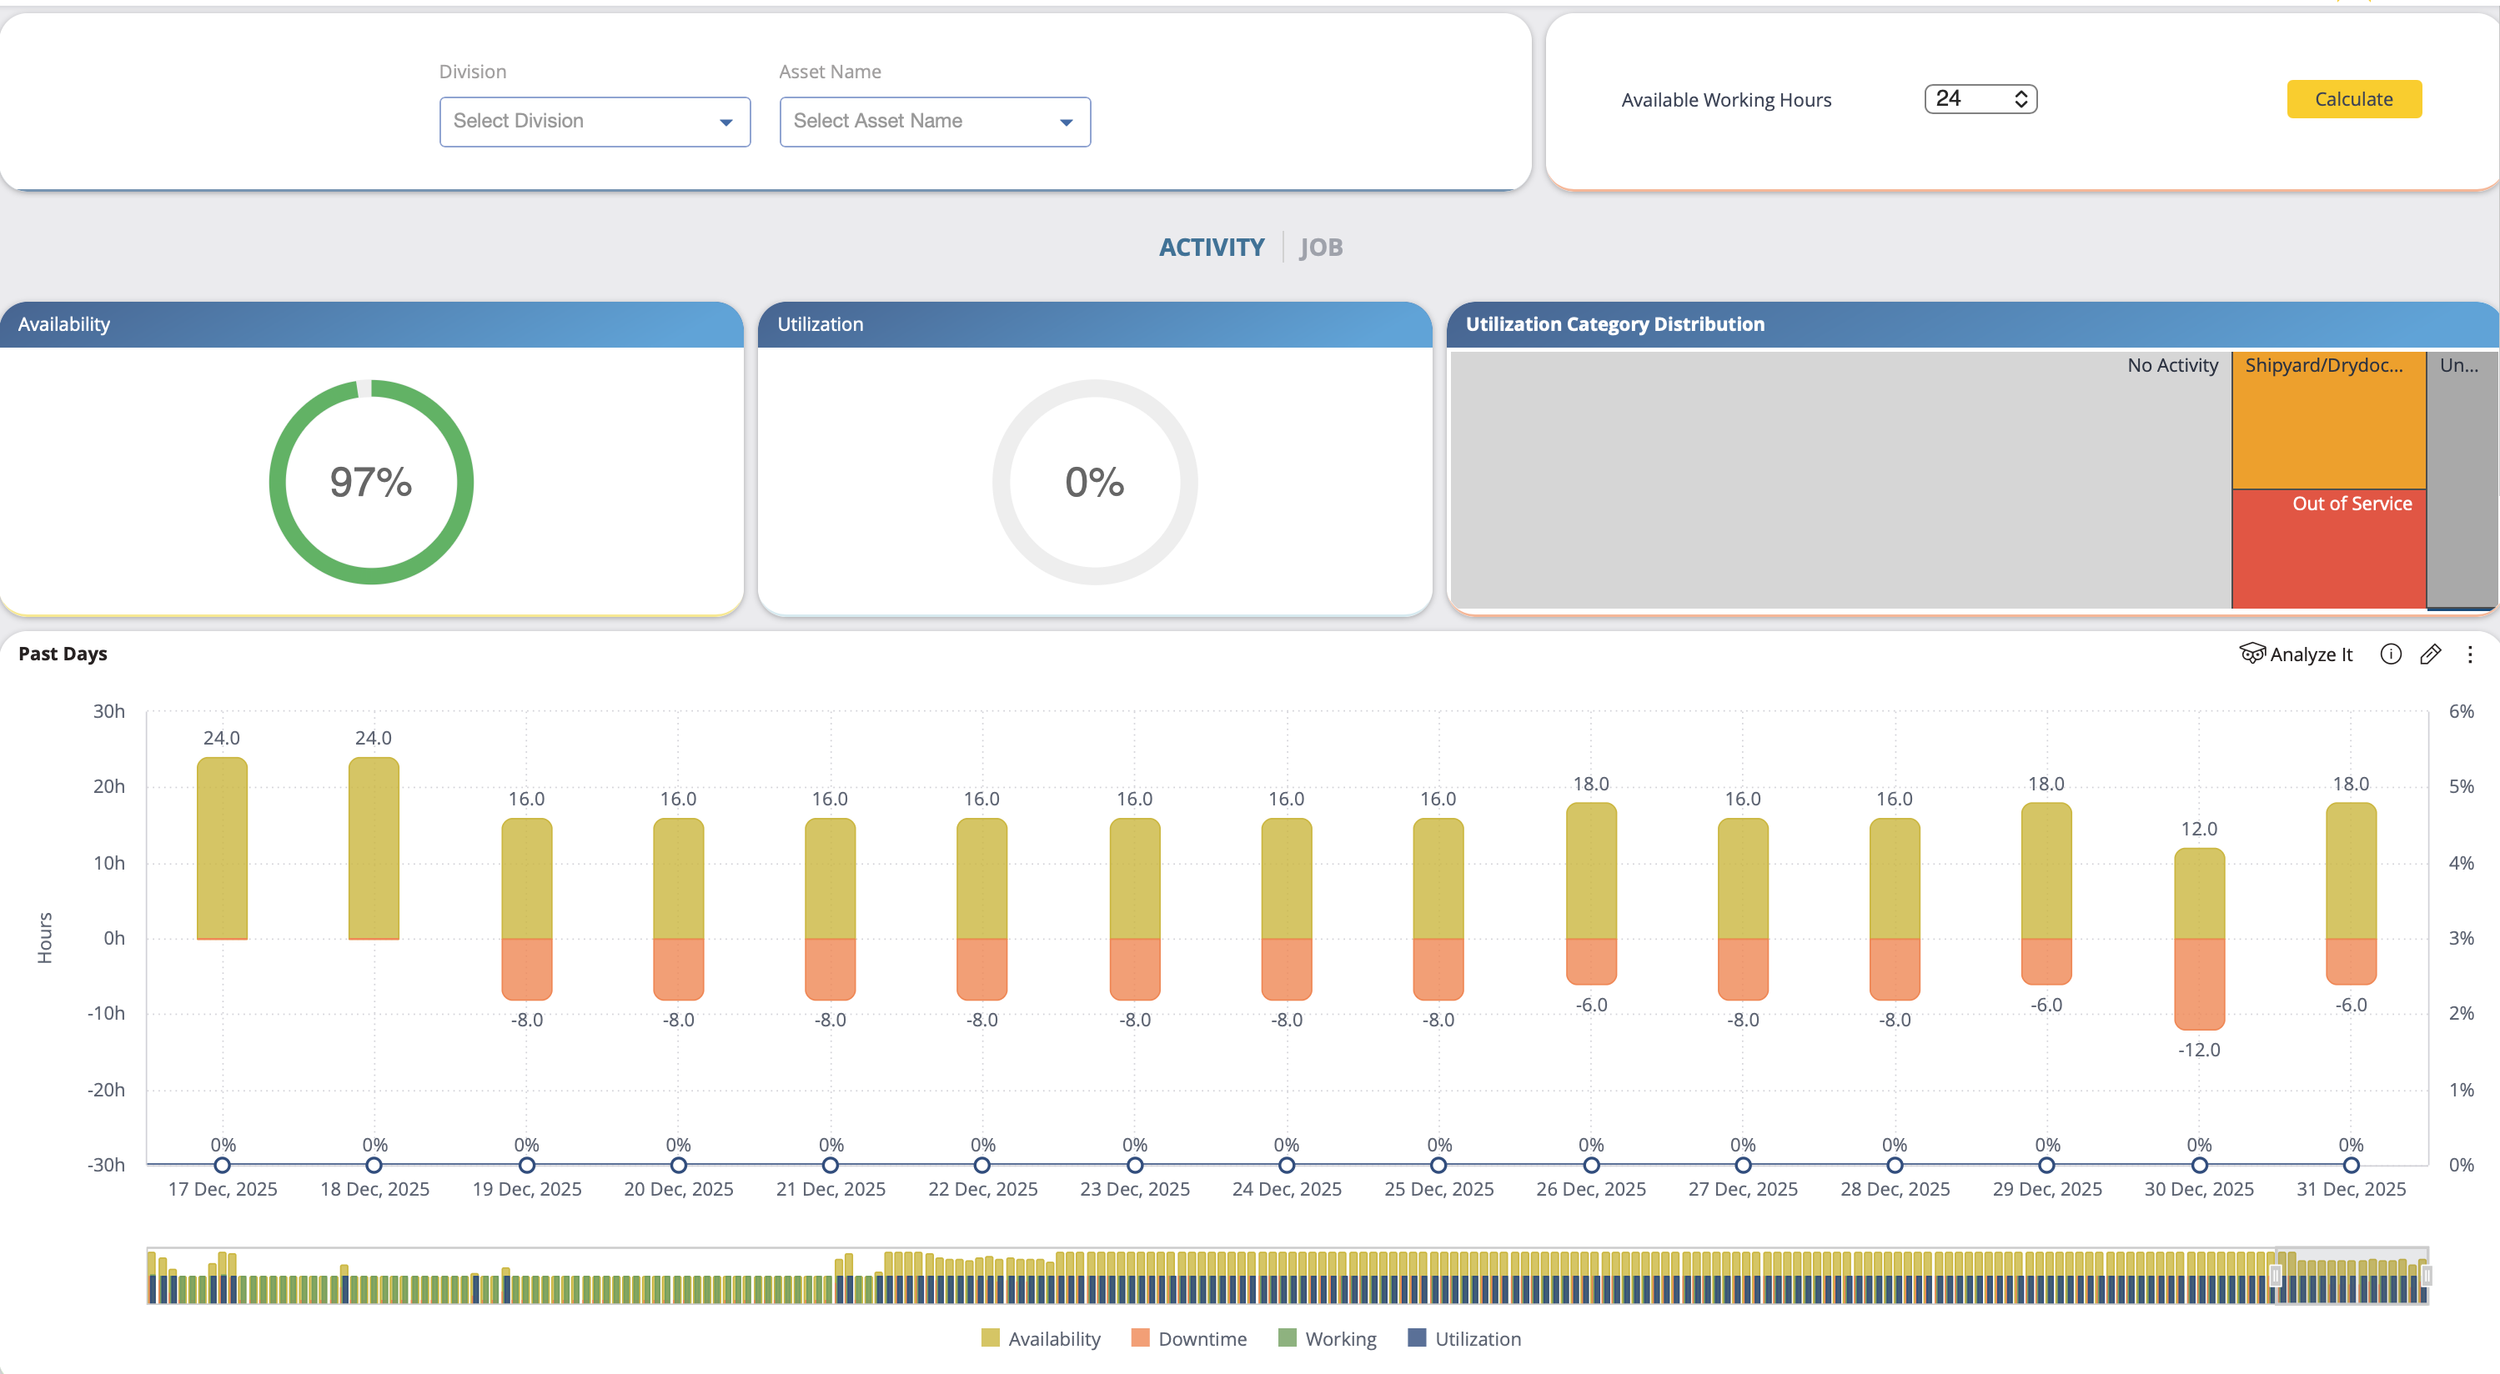
Fleet capacity decisions are expensive. Too many vessels = wasted capital. Too few = lost revenue. This dashboard shows you exactly how many tugs you're using simultaneously, when, and for what — so you can confidently right-size your fleet.
Why this matters:
See utilization patterns — What % of the time are all your tugs working vs. sitting idle?
Identify redeployment opportunities — Move underutilized assets to high-demand ports
Plan for peak periods — Understand if you need more capacity or just better scheduling
Track market share (if you log competitor orders) — Are you capturing your fair share of port traffic?
Real impact: One customer moved 2 tugs from a port where they were only needed simultaneously 8% of the time to a higher-demand port — increasing revenue per asset by 40%.
Perfect for: Operations Directors, Port Managers, Fleet Planners, General Managers
Analytics 1.35 isn't an incremental update — it's a fundamental shift in what Helm CONNECT tells you about your business. Whether you're chasing down a slow invoice, deciding whether to redeploy a tug, or trying to get ahead of a safety trend before it becomes a headline, you now have dashboards built specifically for those decisions.
No setup, no waiting, and no BI team required.
Log in, explore the new dashboards, and let your own data show you where to go next. As always, if you have questions or want a walkthrough, your Helm CONNECT account manager is ready to help.
Ready to explore? Log in to Helm CONNECT and navigate to Analytics to get started.