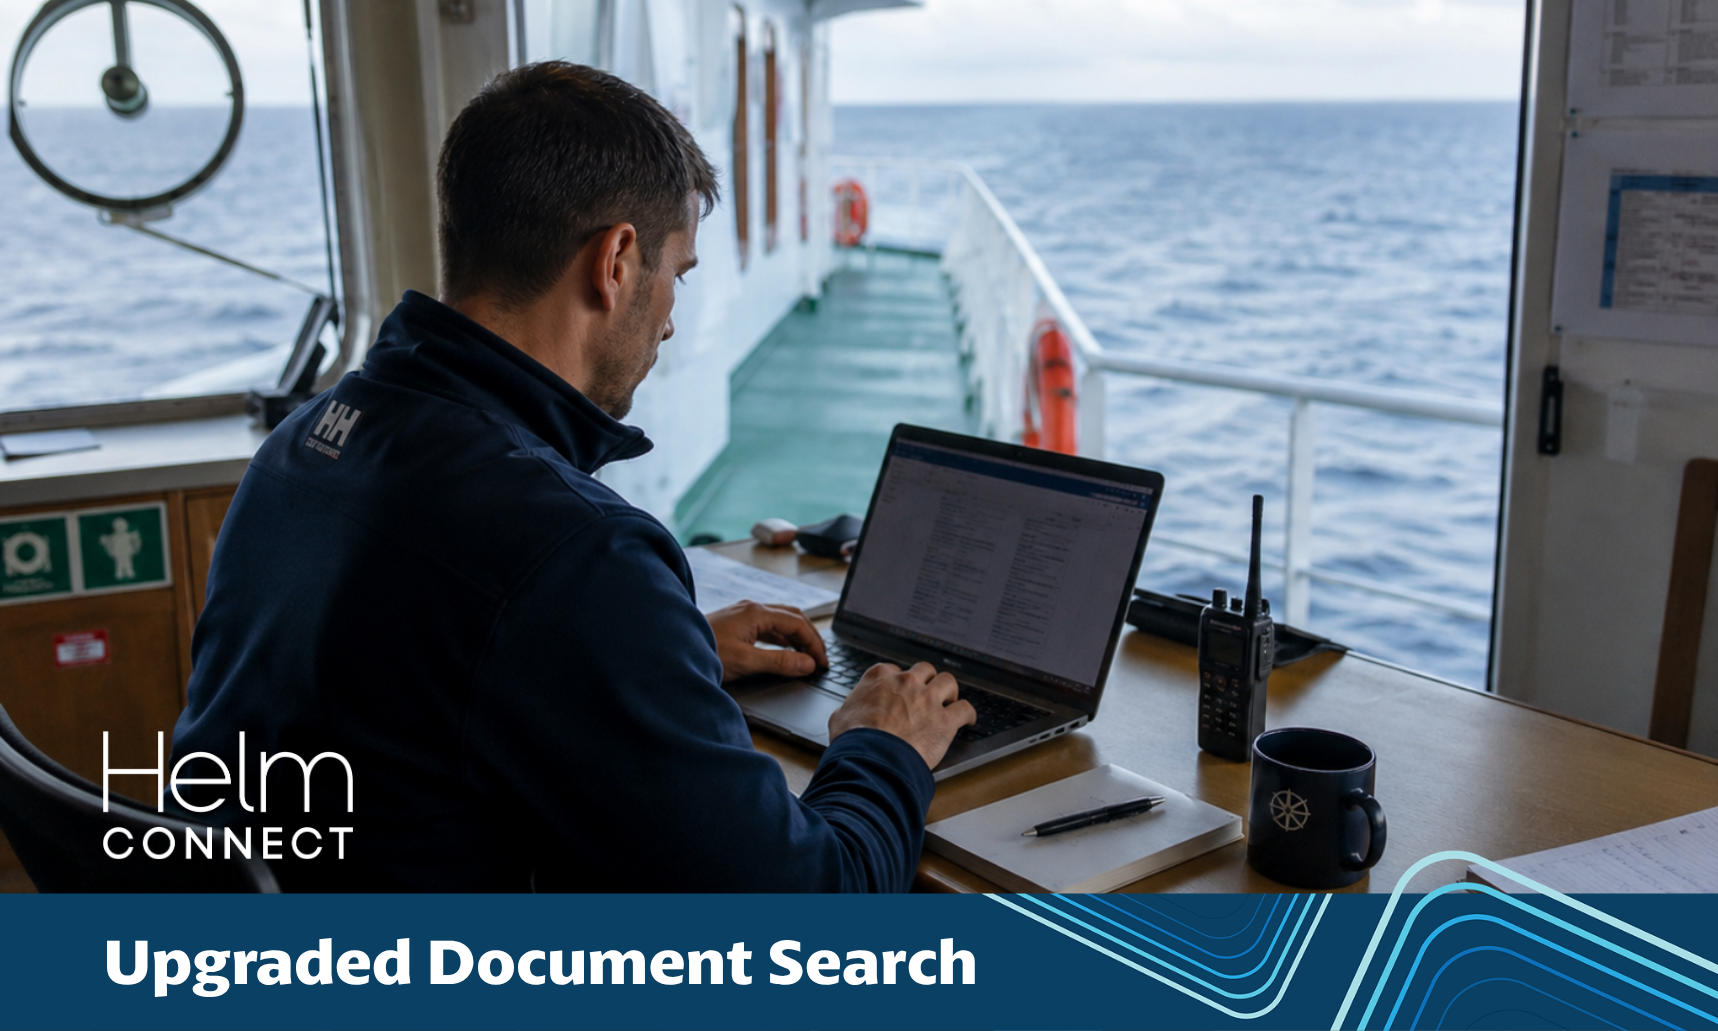
A Document You Can’t Find Might as Well Not Exist
Search just got a major upgrade in Helm CONNECT 1.36 — now you can search inside your documents, not just their titles. This is an ongoing initiative for us to improve safety, reliability, and ease of use.
What's New in Helm CONNECT 1.36?
Our latest release is here, and it's a brighter, more accessible Helm CONNECT. Alongside the first wave of our 2026 brand refresh, we've added French and Italian, and made meaningful updates across our Compliance, Logistics, Personnel, and Analytics product lines. From a fresh new look to faster document search, it's all about making everyday work a little easier. Here's a look at what's new.

Paper Logbooks vs. Digital Logbooks: What the Difference Actually Looks Like on a Working Vessel
If you run a commercial vessel operation, paper logbooks have probably served you fine for years. They're familiar, they're tangible, and they meet the regulatory requirement. Nobody gets fired for keeping paper logs.

Through the Spyglass: Smarter Dashboards and Sharper Insights Coming to Helm CONNECT Analytics
The next release of Helm CONNECT Analytics will bring two brand-new dashboards, one fully rebuilt one, and a long list of improvements designed to change how you spot problems, plan procurement, and make decisions across your fleet.

Helm Conference 2026 Early Bird Tickets Are Live — Here's Everything You Need to Know
If you've been waiting for the green light, here it is. Early bird tickets for Helm Conference 2026 are officially on sale, and we couldn't be more excited to get the armada back together.
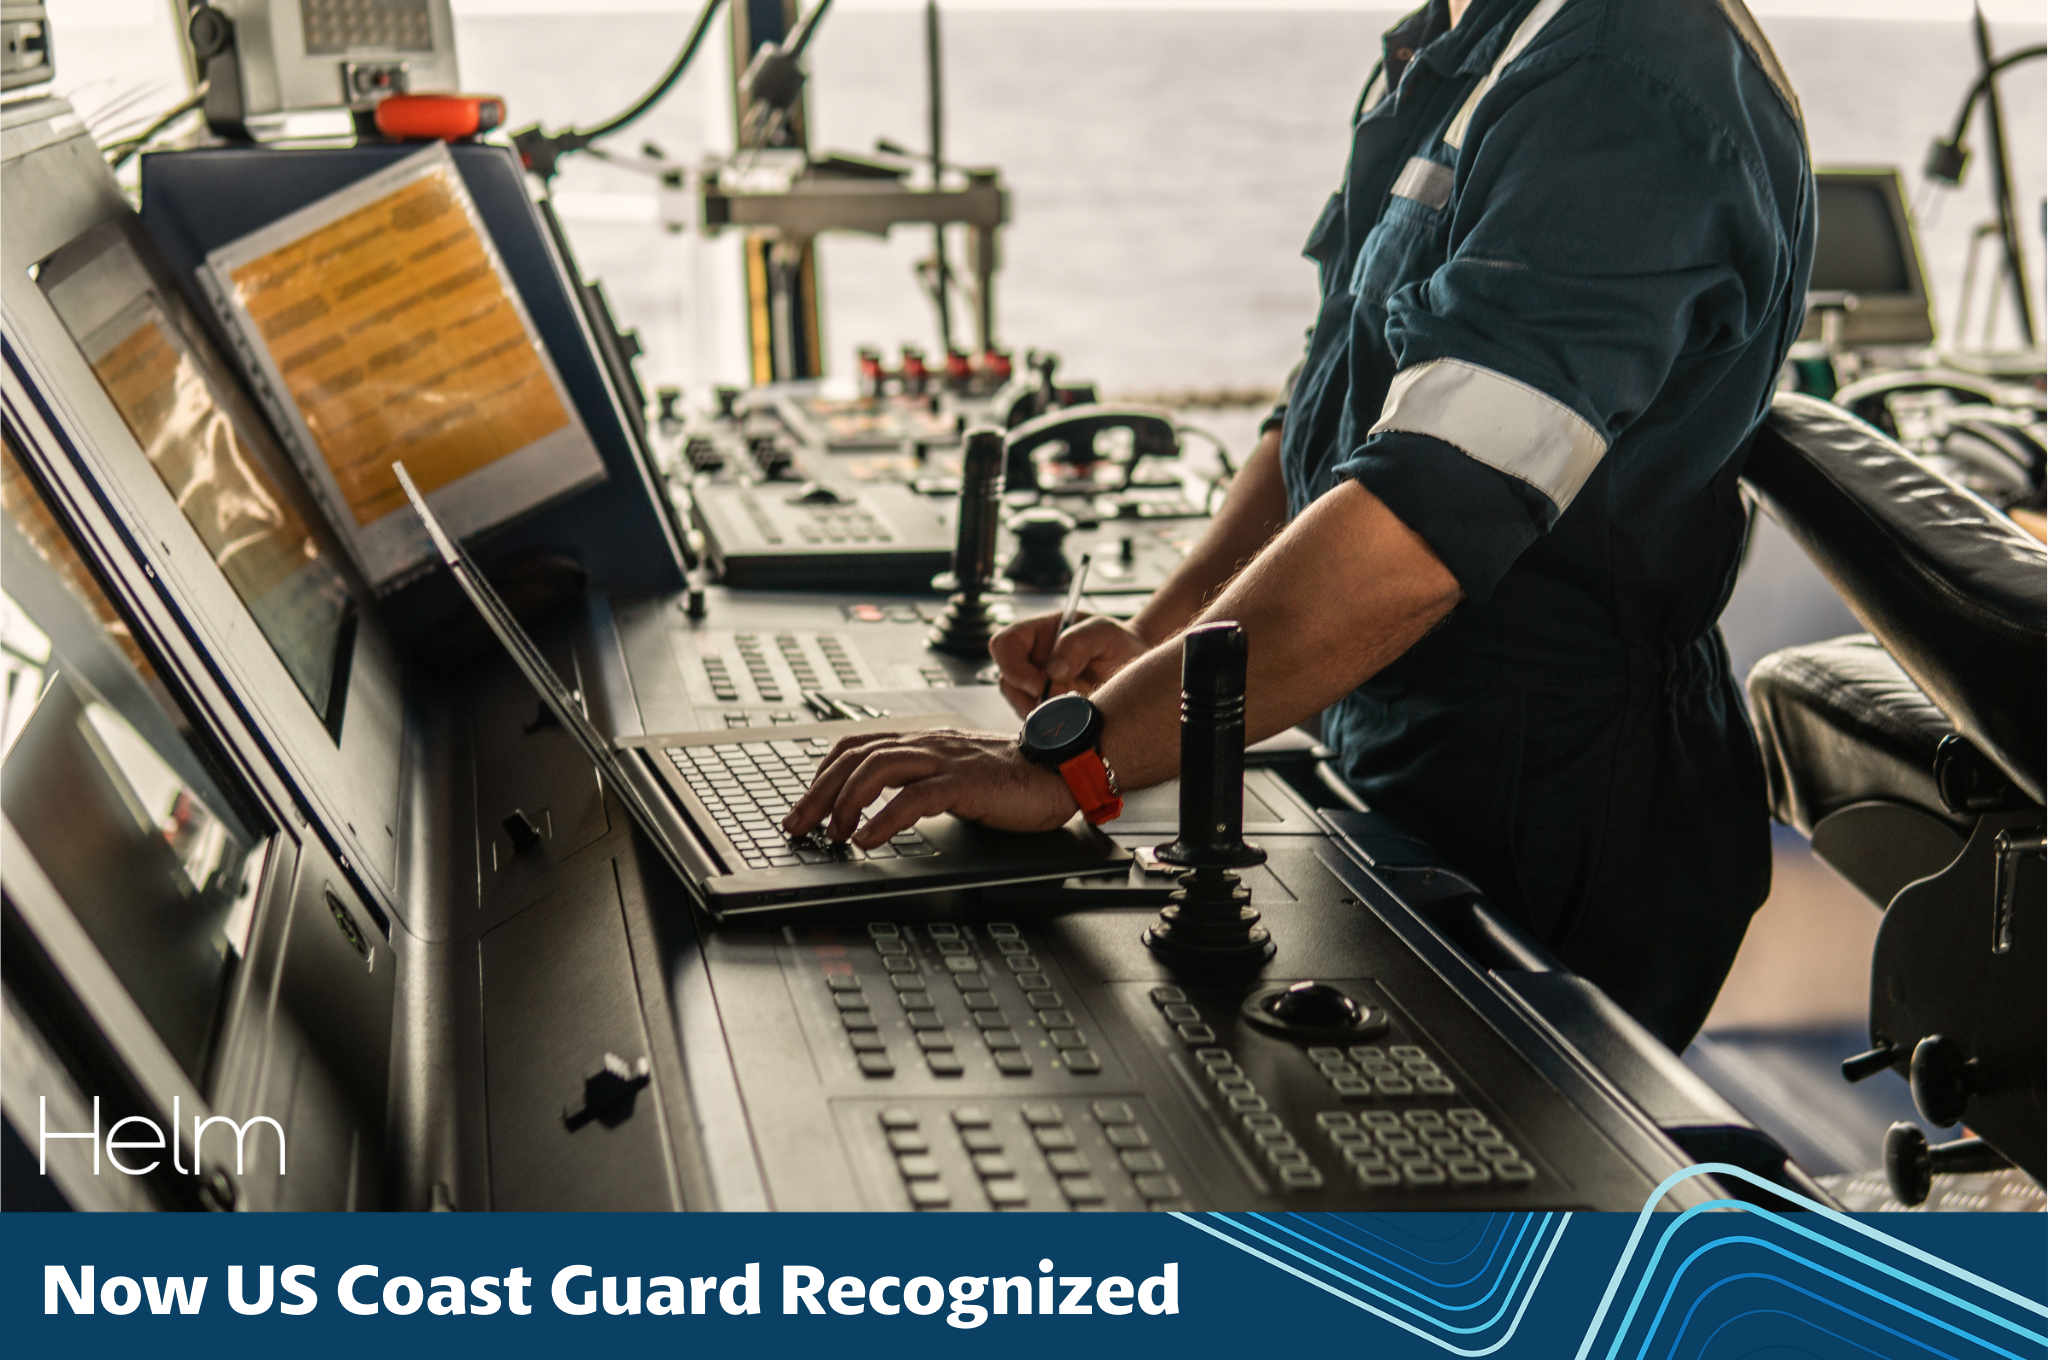
Helm Operations Receives US Coast Guard Recognition for Digital Logbook Solution
Victoria, BC — May 18 2026 — Helm Operations, a market leader in fleet management software for the maritime industry, today announced that Helm CONNECT Logbook has received official recognition from the United States Coast Guard (USCG). The recognition confirms that Helm CONNECT's digital Logbook meets federal standards for commercial vessel record keeping, giving US operators a fully accepted alternative to traditional paper logs.
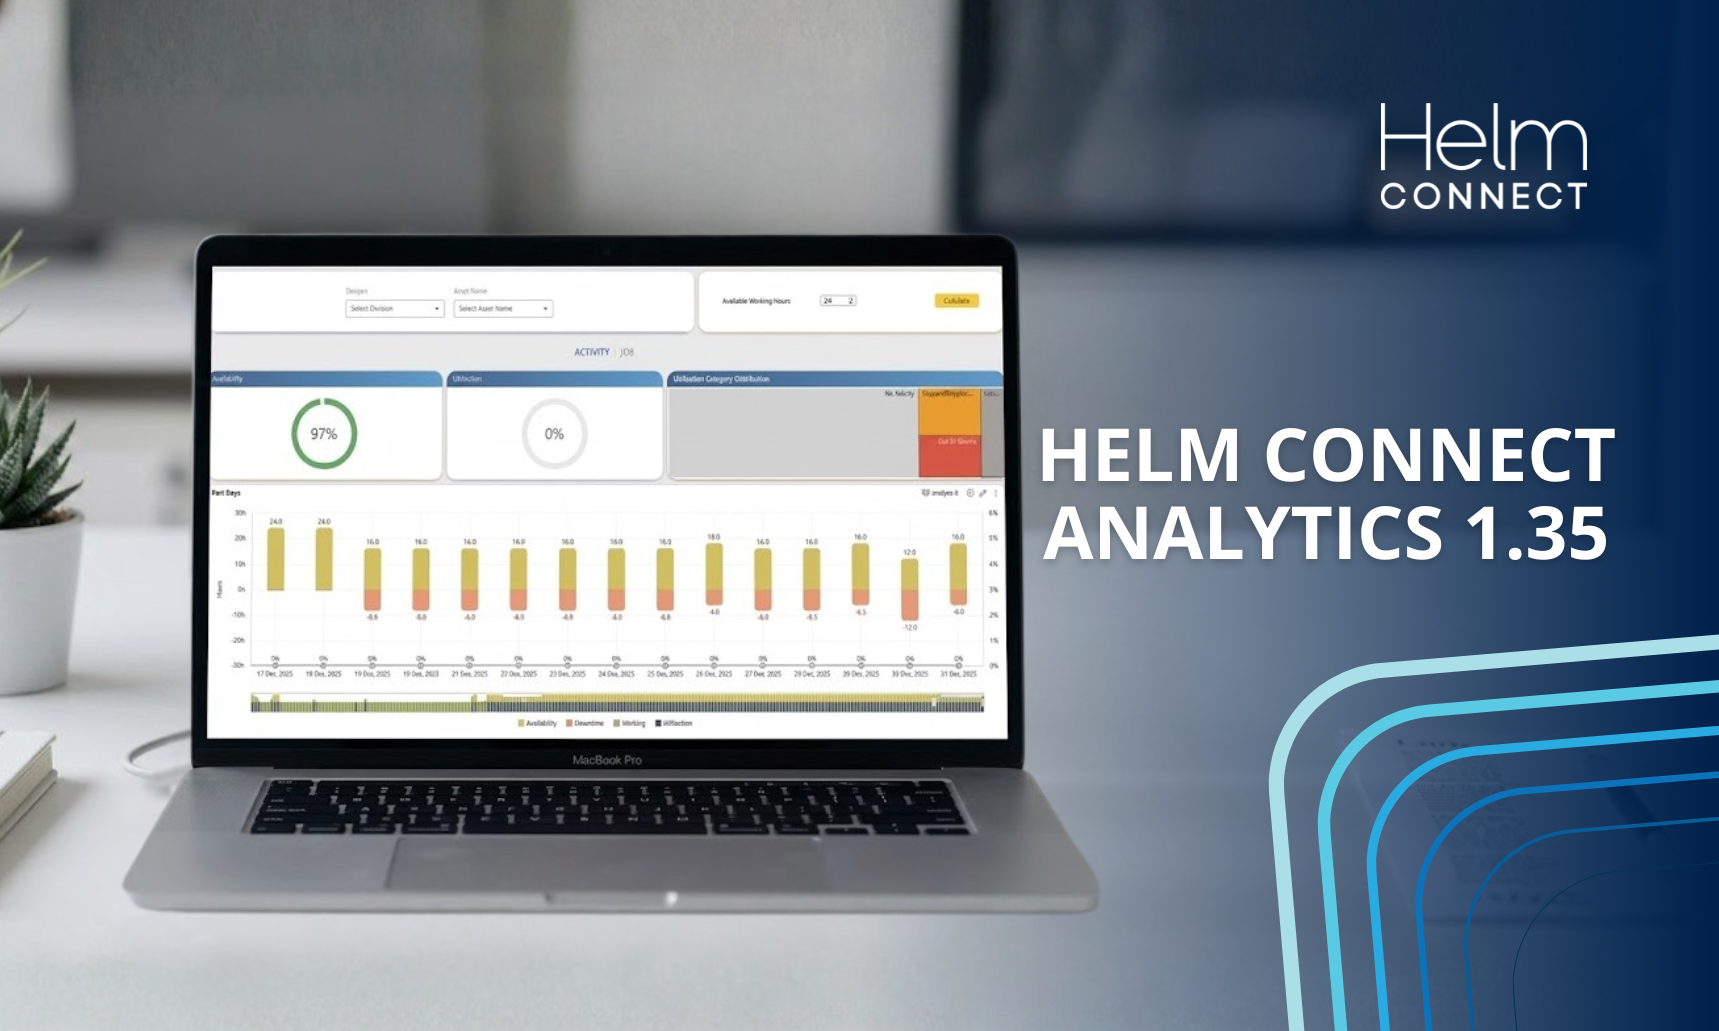
Helm CONNECT Analytics 1.35 - See Everything, Fix Anything
This release is our biggest analytics update yet. We've shipped three completely new dashboards that tackle your most expensive operational challenges — slow billing cycles, fleet overcapacity, and reactive safety management. These aren't minor additions. Each one is designed to surface the insights that directly impact your bottom line, from cash flow optimization to asset utilization to incident prevention.
What's New in Helm CONNECT 1.35?
Helm CONNECT 1.35 is here, and the big news for our Maintenance customers is component groups — a new way to cut down on duplicate templates and keep your setup leaner. We've also made meaningful updates across our Compliance, Logistics, and Personnel product lines. Here's a look at what's new.
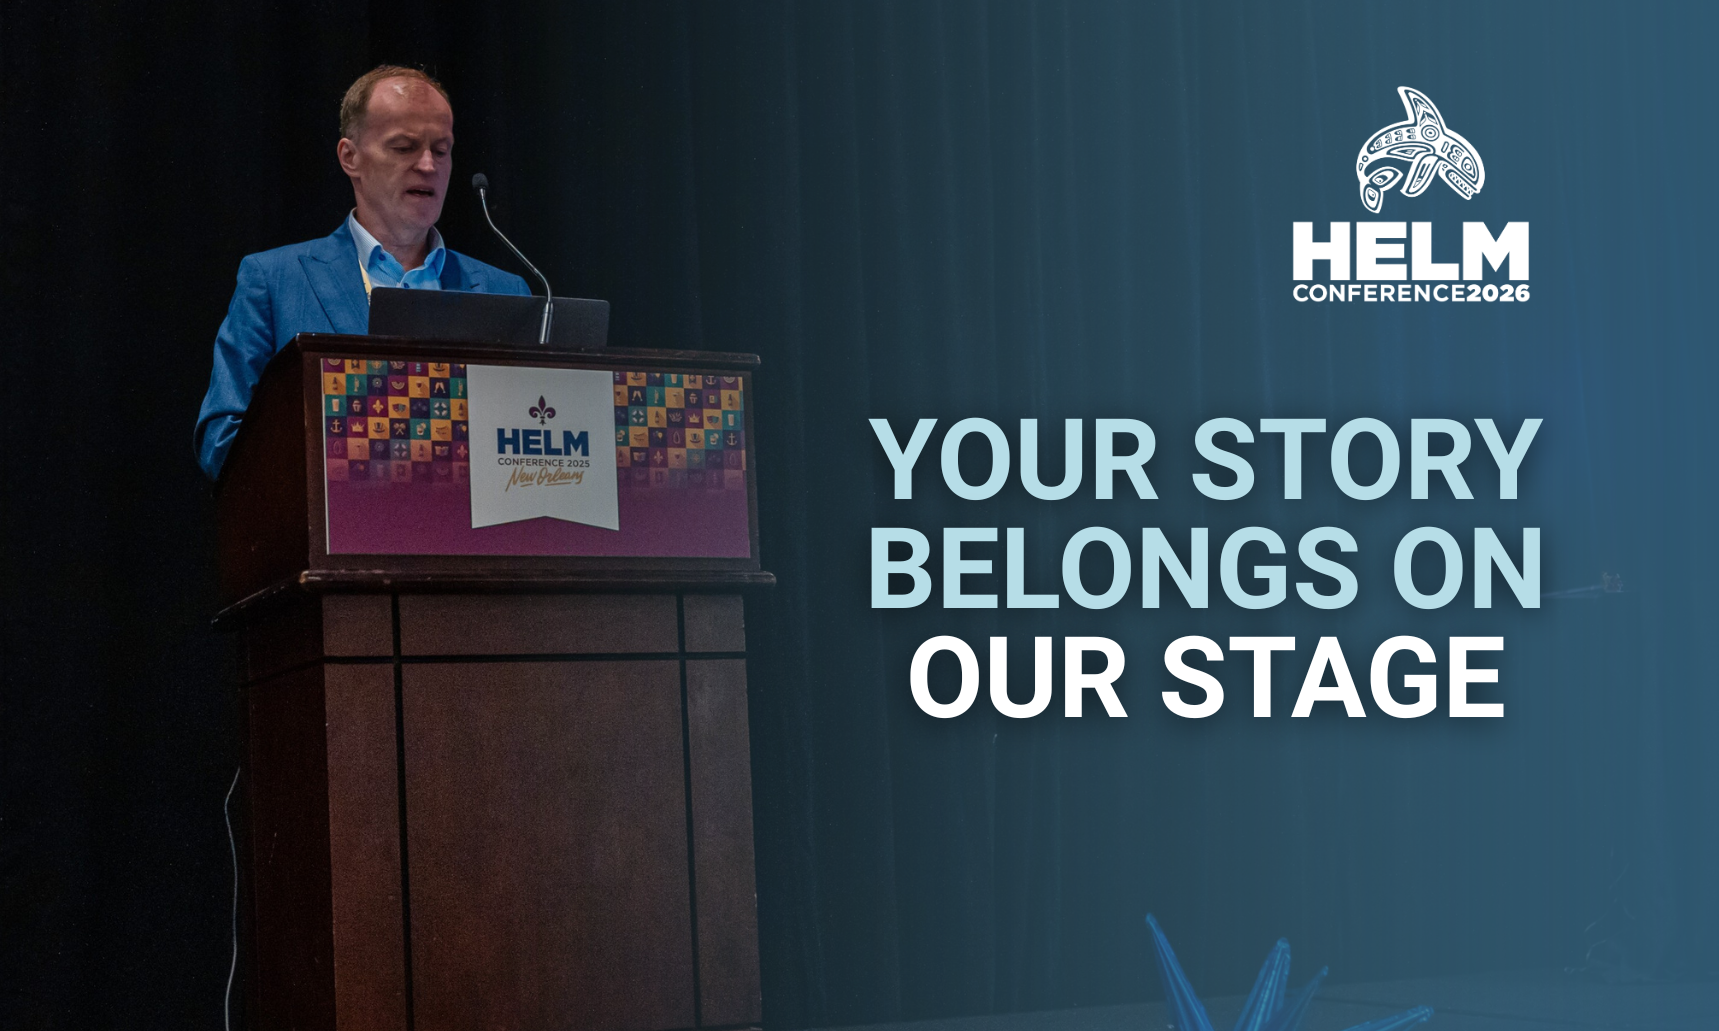
Your Story Belongs on Our Stage
Every year at Helm Conference, something happens that you can’t replicate in a product demo or a webinar. The people actually doing the work — the fleet managers, the dispatchers, the safety officers, the operations leads — get in a room together and start talking. And what comes out of those conversations is genuinely useful in a way that’s hard to manufacture.
Through the Spyglass: Improving Accessibility and Consistency in Helm CONNECT
Welcome to Through the Spyglass! In this series, we preview some of the cutting-edge features coming to Helm CONNECT and invite you to share your thoughts with us. In this edition, we’ll examine some visual changes and UI improvements that we’re working on for later this year.
Butts on Boats: Why You’ll Be Seeing Us Soon
At Helm Operations, a lot of our work happens behind screens. We build software, write documentation, answer support tickets, and make decisions based on workflows and data. But the reality of our customers’ work—the vessels, the crews, the dispatch rooms, the day-to-day operational pressure—often lives somewhere else entirely. It’s not something we can get from an email or a meeting, so this year, we’re going to close that gap.
SIRE Simplified: Helm CONNECT Now Integrates With OCIMF’s Ship Inspection Programme
Staying on top of your operations while ensuring compliance can be a burden when things are busy. When the time comes for your SIRE inspections, the task of tracking, monitoring, and coordinating your inspection’s findings can quickly become a drag on the productivity of key resources. While a necessity for the industry, it begs the question: is there a more efficient way to deal with recurring SIRE inspections?

Helm Reaches 400 Customers for Helm CONNECT, Strengthening Its Position as the Operational Backbone of Modern Fleets
VICTORIA, BC – [December 11, 2025] : Helm Operations announced today that it has reached 400 customers and more than 10,000 vessels and assets running on Helm CONNECT worldwide, marking a major milestone for one of the maritime industry’s most widely adopted maintenance and operations platforms.

Helm is Hitting the Main Aisle at WorkBoat 2025 — Come See What’s New
The Helm crew is heading to New Orleans next week for the International WorkBoat Show, and this year is a little different. For the first time ever, we’re stepping out of the shadows of the side aisles and planting our flag right on the main aisle at Booth 3529. That’s right—big stage, bright lights, and no one can accidentally miss us on their way to a crawfish po’boy.

What's new in Helm CONNECT 1.34?
Welcome to Helm CONNECT 1.34. This release delivers improvements across Logistics, Personnel, and Maintenance, including the rebranding of Helm CONNECT Jobs to Logistics, ongoing enhancements to the new Crew Certifications module, and new workflows for managing low-stock parts.

Automate Your Fluid Analysis with Helm CONNECT
Every day, vessels around the world rely on fluid analysis to keep their engines and equipment running at peak performance. But the process can be slow and fragmented: samples are drawn, shipped to labs, and results trickle back by email — buried in inboxes, misread, or lost in the shuffle.

Charting New Waters: Lloyd’s Register and Marshall Islands Certify Our Electronic Record Books
For operators looking to move away from paper logbooks without compromising compliance, there’s now a class-certified digital alternative.

Helm CONNECT x Moxie Media LMS is Now Live!
We’re excited to announce that Moxie Media’s Learning Management System (LMS) is now seamlessly integrated into Helm CONNECT at no extra cost for users. If you already use Moxie Media’s LMS and want to activate it on Helm CONNECT, simply contact your Account Manager, and they will enable it for you immediately.

Big Changes on the Horizon: Helm CONNECT Jobs Will Soon Become Logistics
At Helm Conference 2025, Rachel Aylard, Product Manager for Helm CONNECT Jobs, shared some exciting news about the future of the product line. For those who weren’t able to join us at the conference, here’s a recap of what we announced, and what it means for you.

Helm Operations Announces Leadership Transition: James Wadsworth Appointed CEO, Nolan Barclay Named Chairman
Helm Operations, the leading provider of maritime operations and crew management software, today announced a key leadership transition as James Wadsworth assumes the role of Chief Executive Officer (CEO). Nolan Barclay, Helm’s first employee and most recent CEO, will continue to support the company as Chairman.